Institutional Insights: Nomura Cross Asset Views 11/09/25
.jpeg)
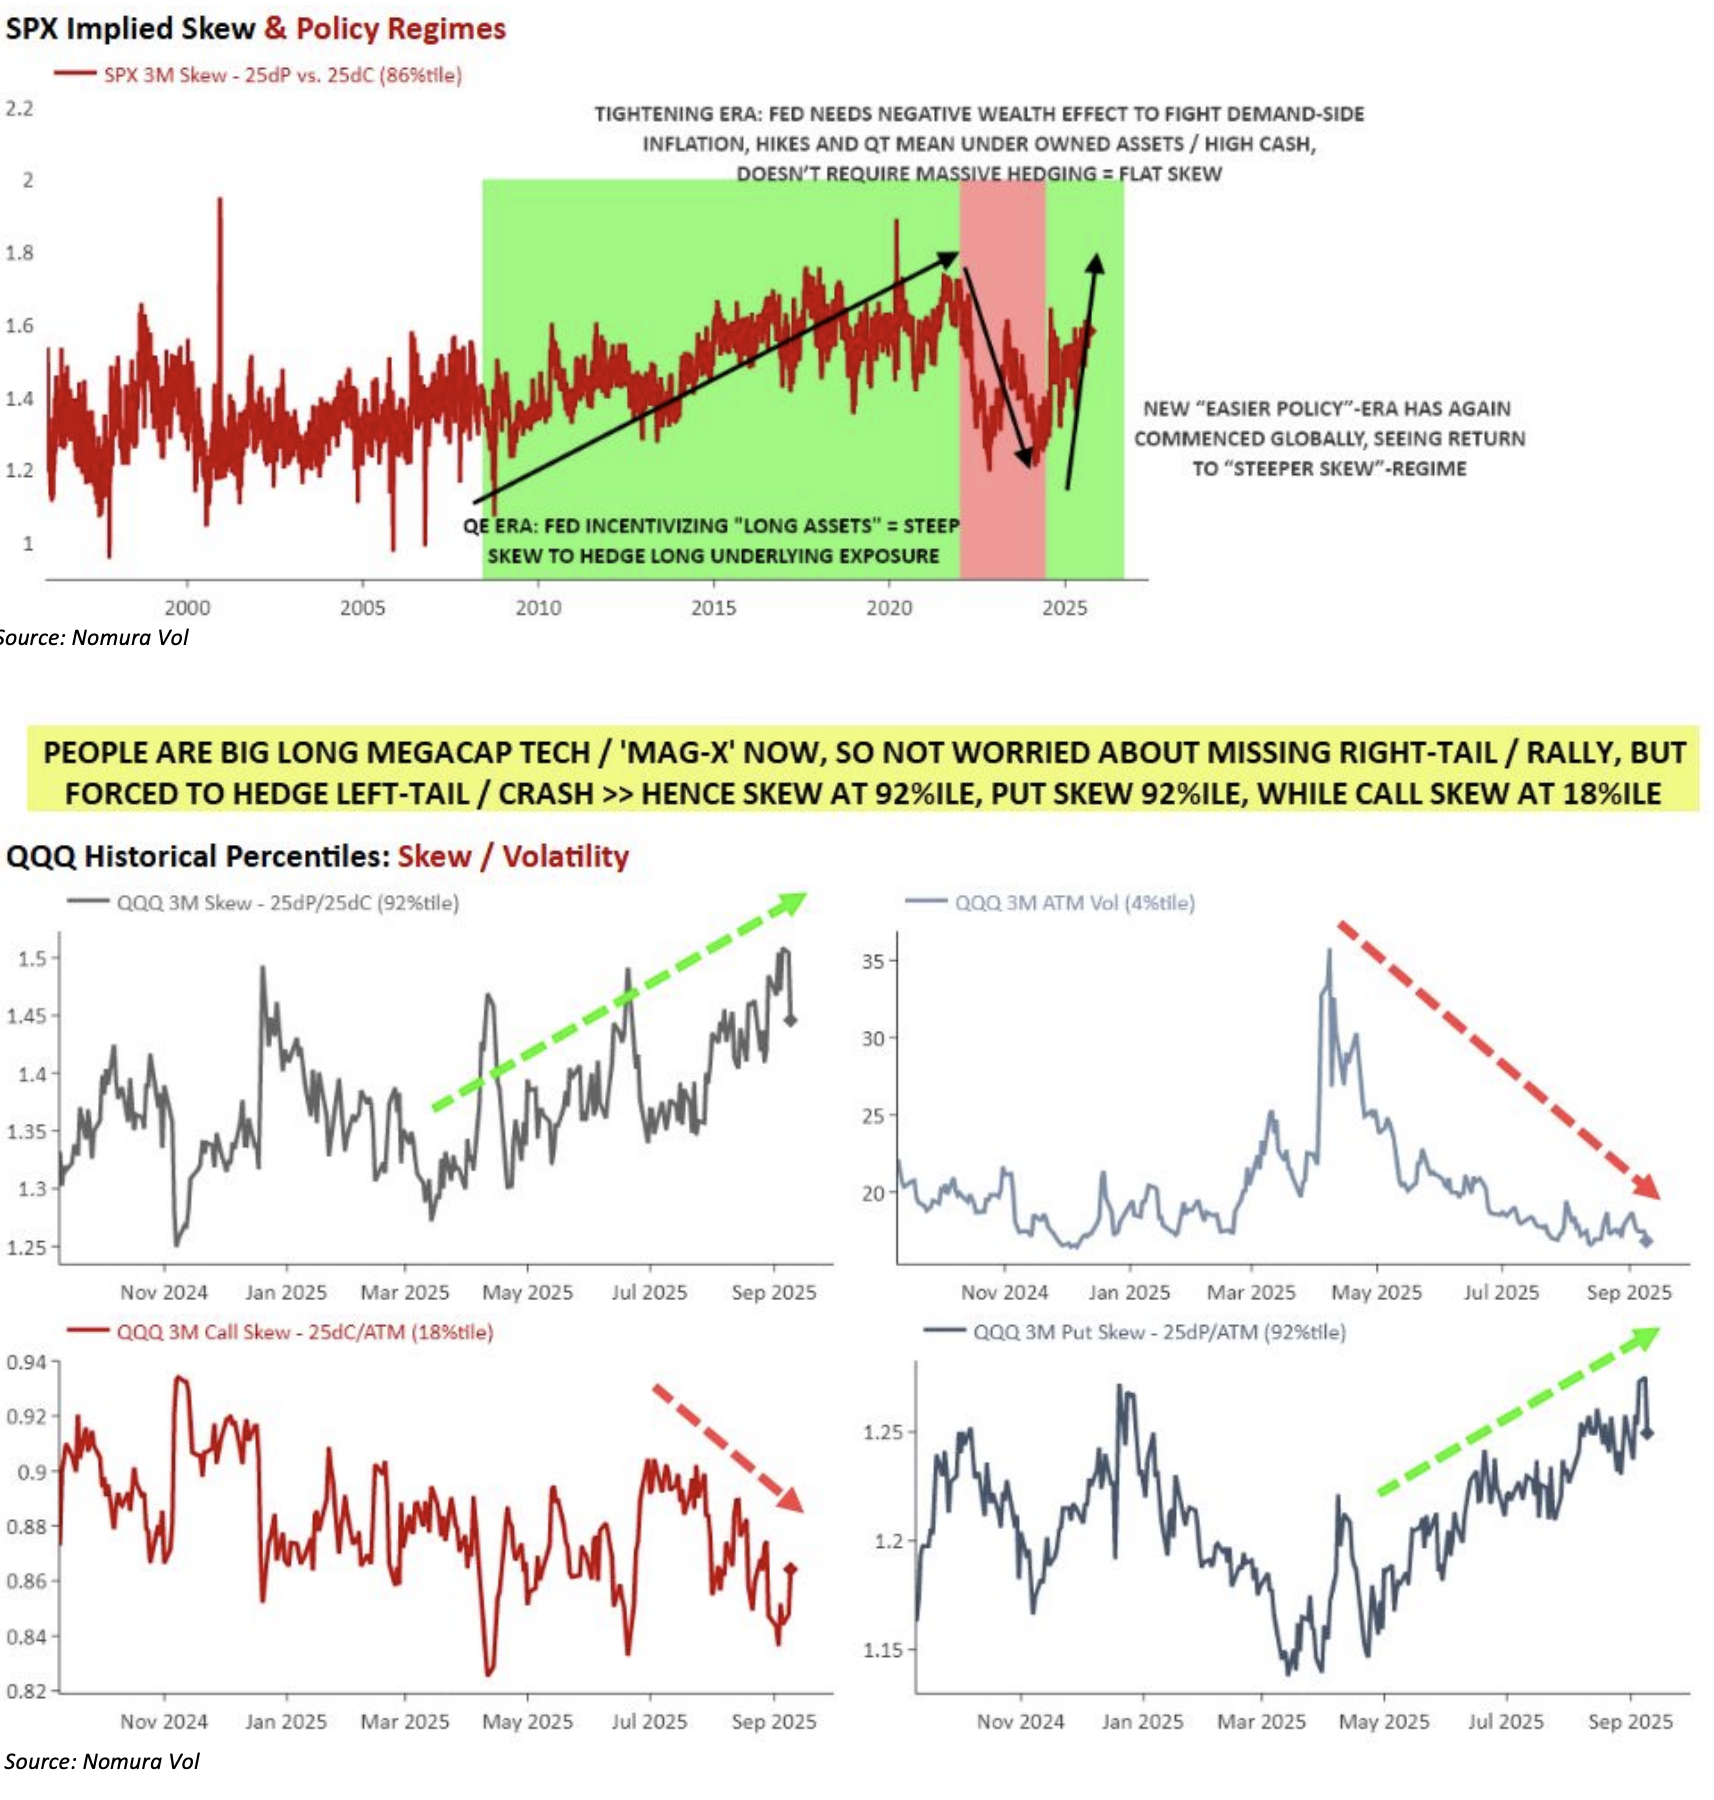
Equities Index Skew remains notably steep due to elevated positioning and net exposure relative to the past year, necessitating downside hedging—particularly in MegaCap Tech and Mag-X. This comes amid swirling market risks tied to policy implications for both the consumer and business cycle. Meanwhile, U.S. stocks hover at all-time highs (ATHs), with low Realized Volatility driving “mechanical” buying and leverage. Central Banks globally remain tilted toward easing, keeping financial conditions loose and sustaining the “wealth effect” across speculative assets—even extending to “Cash/Bills,” which continue to generate substantial discretionary income for investors. On a longer horizon, interest rates remain near historical highs.
As long as labor markets avoid a sharp downturn, the quasi-“Goldilocks” economic narrative persists, though signs of transition from slower hiring to outright layoffs are increasingly evident. The unemployment rate has reached a new cycle high, further underscoring concerns in light of recent revisions to Non-Farm Payroll (NFP) data.
Against this backdrop—and with tomorrow’s CPI release looming—tariff-driven inflation shows signs of intensifying. The Atlanta Fed’s “Sticky CPI” 3-month annualized figure stands at 3.73%, marking a 16-month high. Today’s lighter-than-expected PPI Final Demand data (and its “Ex Food and Energy” component) contrasts with the inline “Ex Food, Energy, and Trade” measure.
The yield curve continues to steepen, despite indications that the global sovereign and STIRS front-end rally may be losing momentum. This is occurring in the absence of even more severe labor and growth data, coupled with persistent inflation concerns. The Fed’s policy trajectory has already been aggressively repriced over the past week and month, raising questions about the sustainability of current market dynamics.
As a side note, with labor and growth data increasingly deteriorating and today’s surprise PPI headline miss, it begs the question: Is this truly a compelling “Buy Risk” economic signal?
The global long-end remains under pressure, struggling to find support despite the widespread trajectory of "fiscal dominance" and mega deficit spending. Supply realities continue to face challenges in generating solid auction demand, compounded by central banks globally maintaining an asymmetric stance toward easing. Cutting cycles remain relatively nascent, with markets pricing in only minimal probabilities of "high for longer" scenarios—let alone outright rate hikes—further risking the entrenchment of sticky inflation.
Meanwhile, the perception that the recently accelerated central bank cut cycle can smooth market volatility and justify elevated Mag-X valuations persists. This, combined with inflows into VRP, premium income strategies, and exotic products, perpetuates a steady supply of volatility. Such dynamics facilitate mechanical demand, while cash flow generation from MegaCap Tech and Mag-X names serves as a significant driver of stock demand and volatility suppression. Stock buybacks shrink float, providing active support during pullbacks and acting as a latent bid during market rallies—effectively serving as the "invisible hand" underpinning the markets.
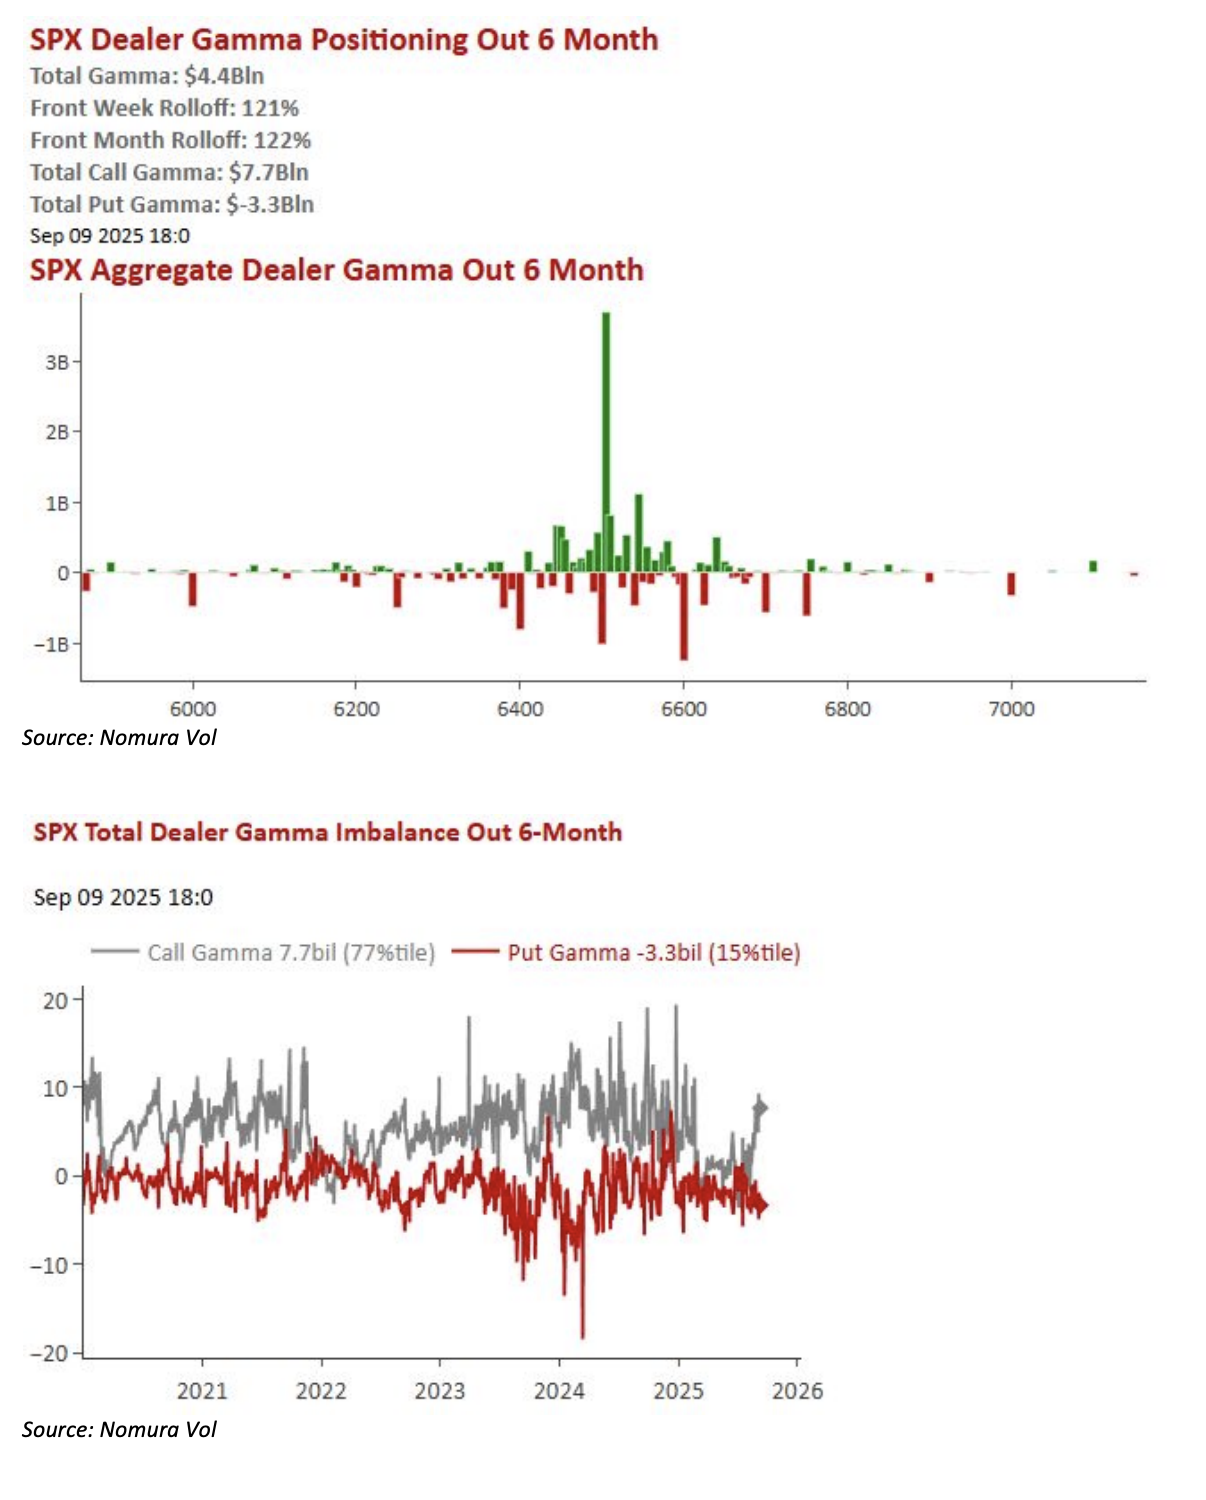
Currently, "Vol Supply" reflects approximately +$4.5B of Long Gamma in SPX concentrated within Dealers and Market Makers, effectively compressing the trading range and maintaining a relatively modest environment. Adding to this dynamic, the persistent activity of Iron Condor sellers continues to influence the market almost daily. SPX’s 10-day realized volatility sits at 8, while broader volatility remains subdued due to low correlation—particularly evident in Nasdaq/Megacap Tech equities (1-month realized correlation at the 7th percentile) and the Tech sector overall (1-month realized correlation at the 4th percentile). This stems from the ongoing earnings dispersion dynamic and the dominant “AI/Mag-X” leadership theme, which has propelled certain sectors and factors forward while leaving others lagging year-to-date.
This brings us to the common cautionary note: The extensive "Long" positioning and high net leverage, driven by the feedback loop of "Low Realized Volatility," ultimately creates an asymmetry tied to unwind risk. This risk stems from various sources, including Volatility Target products, CTA Trend allocations in equities, Dealer Options positioning across both indices and the Mag8 stocks, and the projected rebalancing requirements of Leveraged ETFs. These dynamics result in a significant notional bias toward selling during drawdowns, as opposed to buying during rallies.
The usual caveat arises here: the extensive "Long" positioning and high net leverage, driven by the feedback loop of "Low Realized Volatility," introduces a significant asymmetry in unwind risk. This spans across Volatility Target products, CTA Trend allocations in equities, Dealer Options positioning within both Index and the Magnificent 8 (Mag8), and the projected rebalancing demands of Leveraged ETFs. In drawdowns, these factors collectively amplify the notional tilt toward SELLING compared to rallies.
Moreover, a minor volatility spike could trigger a disproportionately larger notional deleveraging event, given the current elevated levels of "Length." Compounding this risk is the gradual drying up of corporate buyback demand, often referred to as the "Invisible Hand." As we move deeper into September and October, the U.S. equities market faces the Q3 earnings blackout period, with 75% of the S&P 500 entering blackout by October 6, 2025, and 75% of market capitalization affected by October 2, 2025.
Disclaimer: The material provided is for information purposes only and should not be considered as investment advice. The views, information, or opinions expressed in the text belong solely to the author, and not to the author’s employer, organization, committee or other group or individual or company.
Past performance is not indicative of future results.
High Risk Warning: CFDs are complex instruments and come with a high risk of losing money rapidly due to leverage. 71% and 74% of retail investor accounts lose money when trading CFDs with Tickmill UK Ltd and Tickmill Europe Ltd respectively. You should consider whether you understand how CFDs work and whether you can afford to take the high risk of losing your money.
Futures and Options: Trading futures and options on margin carries a high degree of risk and may result in losses exceeding your initial investment. These products are not suitable for all investors. Ensure you fully understand the risks and take appropriate care to manage your risk.
Patrick has been involved in the financial markets for well over a decade as a self-educated professional trader and money manager. Flitting between the roles of market commentator, analyst and mentor, Patrick has improved the technical skills and psychological stance of literally hundreds of traders – coaching them to become savvy market operators!