S&P500 Daily Action Areas & Price Targets 10/8/26

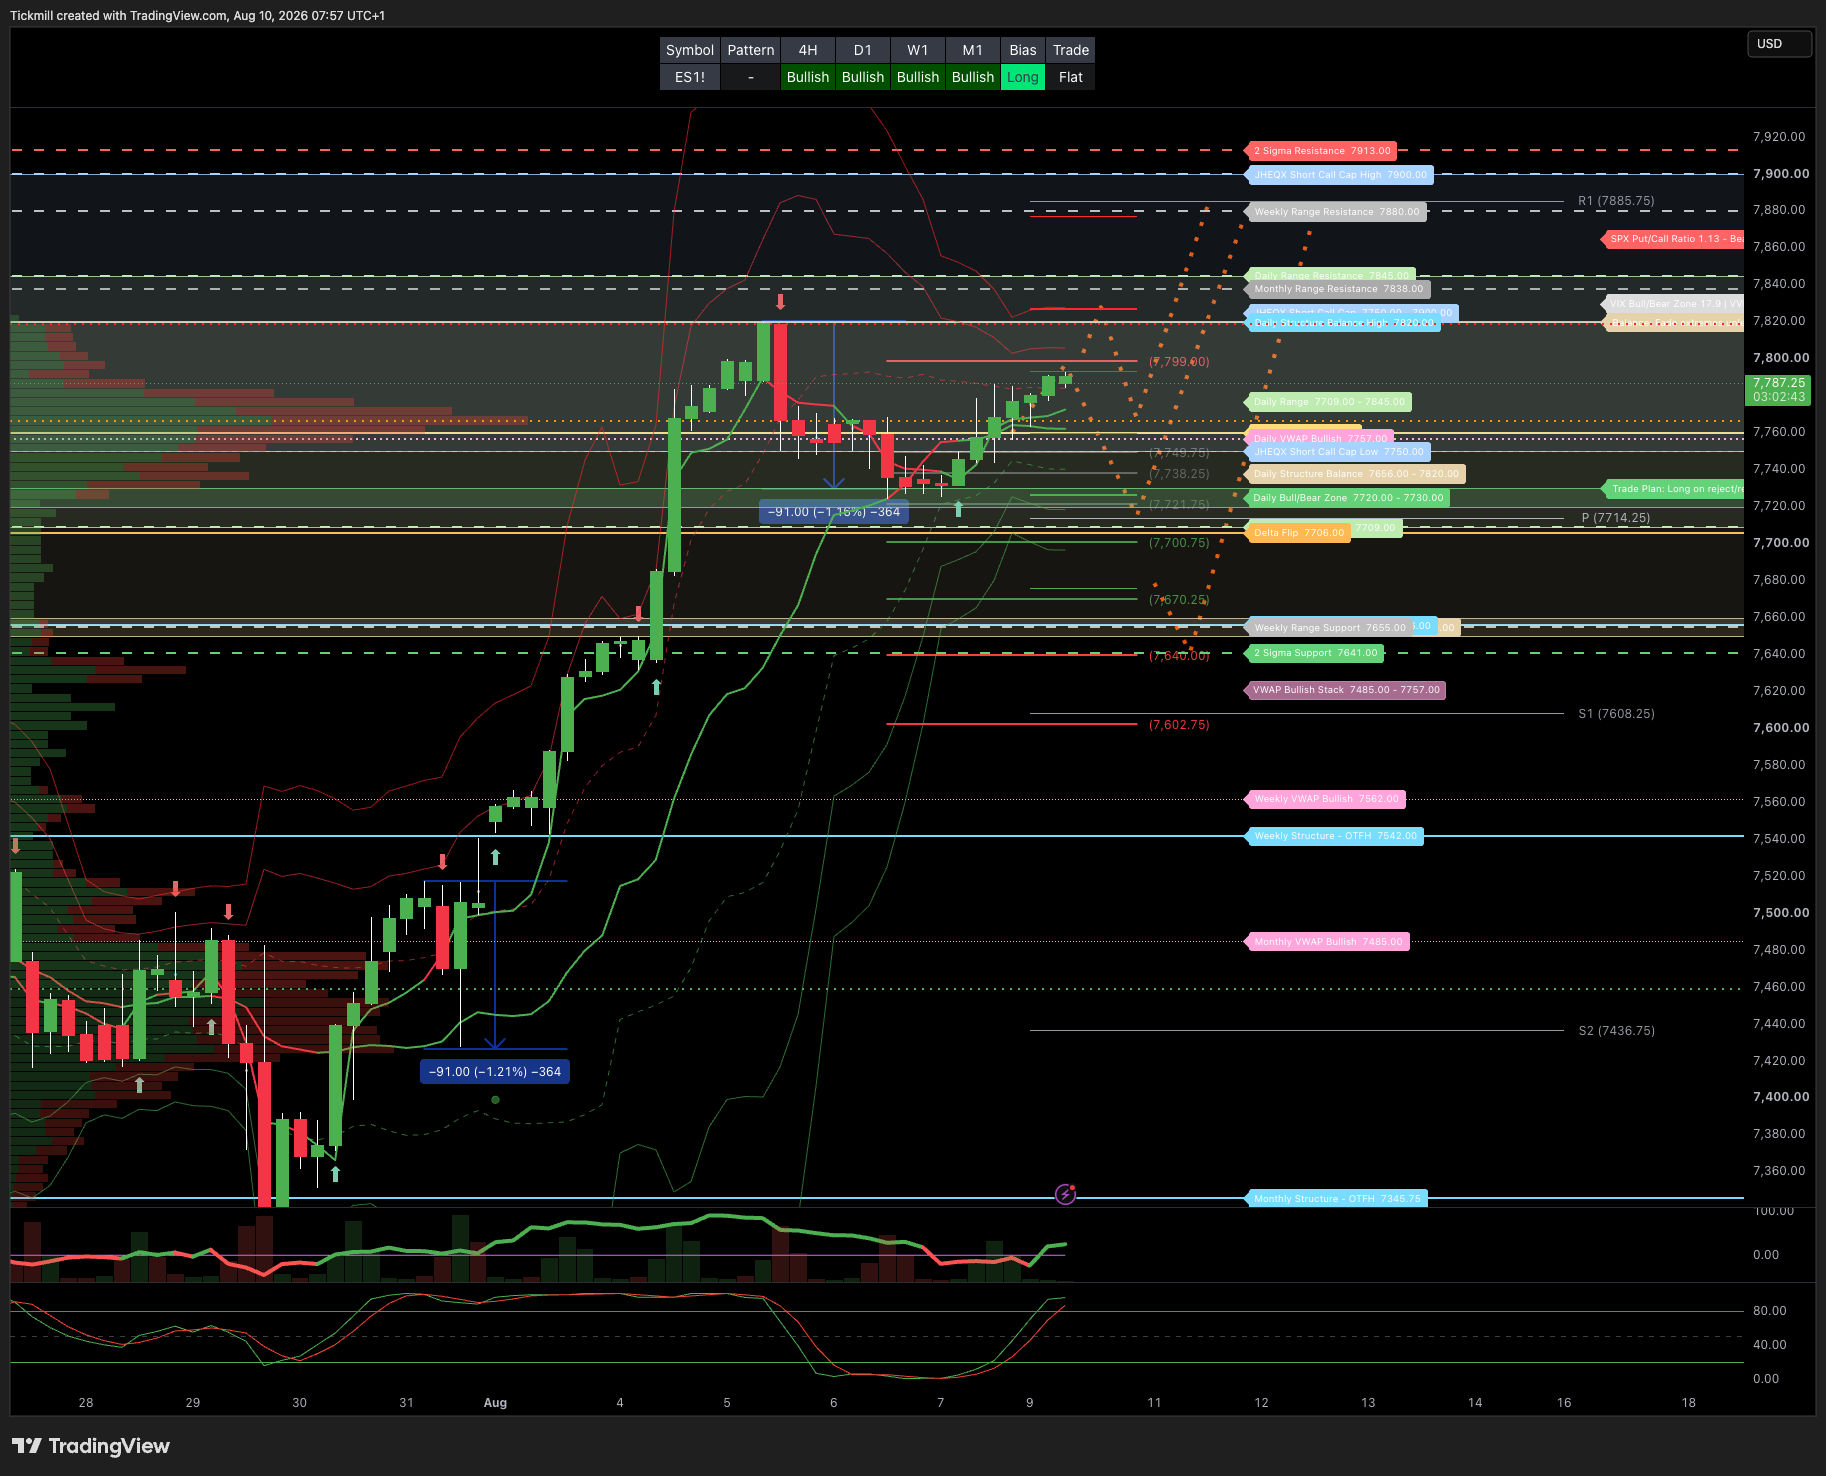
S&P500 Daily Action Areas & Price Targets 10/8/26
***QUOTING ES1! FOR CASH US500 EQUIVALENT LEVELS, SUBTRACT POINT DIFFERENCE***
WEEKLY BULL BEAR ZONE 7660/50
WEEKLY RANGE RES 7880 SUP 7655
MONTHLY RANGE RES 7838 SUP 7258
JHEQX Q3 Collar Short Call Cap: ~7,750 – 7,900 - Long Put Strike: ~7,050 – 7,100 (approx. 5% downside protection) Short Put Strike: ~5,950
DEC2025 OPEX to DEC2026 OPEX is 945 points giving us a range of [5889,7779]
SPX PUT/CALL RATIO 1.13 (The numbers reflect options traded during the current session.) A put-call ratio below 0.7 is generally considered bullish, and a put-call ratio above 1.0 is generally considered bearish.
GS Flow Desk: large S&P 31Aug 7000/7950 strangle in roughly $20mm vega / $115mm premium …My Read – classic “big convexity versus carry” trade: either someone paid a lot to own a wide August move, or someone got paid a lot to bet that the S&P stays comfortably inside the 7000–7950 corridor
DAILY VWAP BULLISH 7757
WEEKLY VWAP BULLISH 7562
MONTHLY VWAP BULLISH 7485
DAILY STRUCTURE - BALANCE - 7820/7656
WEEKLY STRUCTURE - OTFH - 7542
MONTHLY STRUCTURE - OTFH - 7345.75
Balance: This refers to a market condition where prices move within a defined range, reflecting uncertainty as participants await further market-generated information. Our approach to balance includes favouring fade trades at the range extremes (highs/lows) while preparing for potential breakout scenarios if the balance shifts.
One-Time Framing Higher (OTFH): This represents a market trend where each successive bar forms a higher low, signalling a strong and consistent upward movement.
One-Time Framing Lower (OTFL): This describes a market trend where each successive bar forms a lower high, indicating a pronounced and steady downward movement.
DAILY BULL BEAR ZONE 7720/30
GAMMA FLIP 7760
DELTA FLIP 7706
DAILY RANGE RES 7845 SUP 7709
2 SIGMA RES 7913 SUP 7641
VIX BULL BEAR ZONE 17.9 (VVIX / VIX) 6.07
TRADES & TARGETS
LONG ON REJECT/RECLAIM DAILY BULL BEAR ZONE TARGET DAILY RANGE RES
***ADDITIONAL SETUPS & TARGETS HIGHLIGHTED ON THE CHARTS***
(I FADE TESTS OF 2 SIGMA LEVELS ESPECIALLY INTO THE FINAL HOUR OF THE NY CASH SESSION AS 90% OF THE TIME WHEN TESTED THE MARKET WILL CLOSE ABOVE OR BELOW THESE LEVELS)
GOLDMAN SACHS FICC & EQUITY TRADING DESK VIEWS
US Equity Supply / Demand — S&P 8k, Wall of Worry, and Why Record Issuance Is Still Digestible
The note’s message is straightforwardly bullish: despite record equity issuance, the US equity market should continue to digest supply because corporate demand via buybacks remains larger than issuance. The S&P 500 closed at a new all-time high of 7,757 on Friday — its 26th ATH this year and 122nd since the start of 2024 — and the author argues the wall of worry around geopolitics, higher rates, and AI sustainability remains fuel rather than a ceiling.
The punchline:
Record issuance is not the same thing as excessive supply. In market-cap terms, 2026 equity issuance is still normal, while buyback demand remains very large. S&P 500 8,000 remains the target.
1. Market Backdrop: All-Time Highs Despite Persistent Anxiety
The S&P 500 closed Friday at:
Index | Close |
|---|---|
S&P 500 | 7,757 |
This marked:
26th all-time high of 2026
122nd all-time high since the start of 2024
The rally has occurred despite persistent investor anxiety around:
Geopolitics
Higher rates
Fed credibility
Term premium
AI capex sustainability
AI monetization / ROI
Record issuance
Momentum unwind risk
That wall of worry has not stopped the market. If anything, it has prevented full euphoria and created room for re-risking.
2. The Core Question: Can the Market Digest Record Issuance?
Investors are focused on whether record equity issuance will become a headwind.
The note’s answer for the remainder of 2026 is:
Yes, the market can digest it.
Why?
Because supply is record in dollars, but not excessive relative to the size of the equity market.
Estimated 2026 corporate equity supply:
Source | Estimated 2026 Volume |
|---|---|
IPO volume | Slightly above US$225bn |
Other issuance | Around US$450bn |
Total corporate equity supply | Around US$700bn |
That US$700bn equates to roughly 1% of Russell 3000 market cap, similar to average annual issuance from 2015–2019.
So the framing is:
Record Dollar Issuance≠Record Issuance BurdenRecord Dollar Issuance=Record Issuance Burden
because the market itself is much larger.
3. Buybacks Are More Resilient Than Investors Appreciate
The other side of the supply equation is corporate demand.
S&P 500 buyback growth is tracking:
+11% y/y in Q2
This is notable because many investors expected buybacks to weaken as hyperscalers redirected cash flow toward AI capex.
That did happen in parts of mega-cap Tech. But other sectors have offset it.
Buyback growth is being supported by:
Banks
Semiconductors
Other non-hyperscaler corporates expanding repurchase programs
Total US buyback authorizations are running at:
US$989bn YTD
A record pace
This means the demand side remains powerful.
4. Corporate Demand Should Outweigh Equity Supply
The note estimates:
Metric | 2026 Estimate |
|---|---|
Gross US public-market share repurchases | US$1.4tn |
Corporate equity supply | US$700bn |
That implies buybacks could be roughly 2x direct corporate equity issuance:
1.4tn700bn=2.0x700bn1.4tn=2.0x
This is the central bullish supply / demand argument.
Even after accounting for large potential supply from expiring post-IPO lockups, the note expects corporate demand to outweigh supply — even assuming unrealistically that all unlocked shares are immediately sold.
So the market’s supply-demand balance remains favorable:
Buybacks+Corporate Demand>Issuance+Lockup SupplyBuybacks+Corporate Demand>Issuance+Lockup Supply
5. Q2 Was a Record Issuance Quarter
US corporates raised:
US$252bn of equity in Q2
This includes:
IPOs
Follow-ons
Converts
SPACs
That eclipsed the previous quarterly record:
US$234bn in Q1 2021
So issuance is clearly elevated in dollar terms.
But the note argues investors should distinguish between:
Dollar volume, which is record
Market-cap-adjusted volume, which is normal
That distinction matters for whether issuance becomes a market headwind.
6. Follow-On Issuance: Large Dollars, But Normalized Activity
Follow-on offerings accounted for:
US$70bn of Q2 issuance volume
US$105bn YTD through July
This excludes:
Non-US companies
ADRs
Offerings smaller than US$25m
That is the largest YTD follow-on volume at this point in the calendar year since 2021.
But again, relative to market cap and number of offerings, follow-on activity looks more like a return to normal than a boom.
The note states that both:
Number of offerings
Issuance volume scaled to equity market cap
are tracking slightly below historical averages.
The conclusion:
The follow-on market is open, but not overwhelming the broader equity market.
7. Issuance Is Highly Concentrated
A key reason the market can absorb issuance is concentration.
Across IPOs and follow-ons:
The three largest offerings have accounted for nearly half of total issuance volume YTD.
That means issuance is not broadly pressuring all sectors or the whole market. It is concentrated in a few large, liquid transactions.
Market implication:
Large-cap liquidity can absorb large blocks.
Broad market supply pressure is less severe.
Idiosyncratic supply events matter more than aggregate issuance headlines.
8. AI Issuance Is a Major Theme
AI-related issuance has accounted for about:
40% of US equity follow-on volume this year
That is a major thematic concentration.
Historically, Healthcare is typically the largest sector contributor to follow-on issuance, and it remains large this year. But TMT has become unusually important.
TMT has accounted for nearly:
30% of YTD follow-on volume
That is more than double the sector’s share of issuance during the past five years.
The implication is that the AI buildout is now becoming a capital-markets funding cycle.
9. AI Capex Creates a Growing External Financing Need
The note highlights that hyperscaler capex is expected to exceed:
US$1tn in each of the next few years
This equates to more than:
100% of cash flow from operations through 2027
That is a huge statement. It implies that, at the aggregate level, hyperscaler AI investment plans are beginning to exceed internally generated operating cash flow.
Investor conversations suggest expectations are even higher:
Most equity investors expect hyperscaler capex to exceed consensus.
Other companies are also expected to raise capital to support AI investment plans.
So the AI capex boom is not just an earnings theme. It is a financing theme.
10. Debt Will Fund Most AI Capex, but Equity Will Still Matter
The note expects debt markets to provide most external capital for the AI boom.
Credit strategists expect hyperscalers to fund:
35% of 2027 capex with debt
That equates to global issuance of roughly:
US$400bn
Other AI infrastructure firms will likely raise additional capital as well.
For some companies, modest equity raises can make sense because they:
Extend runway for multi-year investment plans
Preserve balance-sheet quality
Avoid excessive leverage
Avoid debt-market capacity constraints
Signal long-term investment ambition
Diversify funding sources
This is particularly relevant for AI infrastructure firms that are not as cash-rich as the largest hyperscalers.
11. Why Record Issuance Is Not Bearish by Itself
The market can digest record issuance when three conditions hold:
1. Issuance Is Small Relative to Market Cap
US$700bn is large, but only about 1% of Russell 3000 market cap.
2. Buybacks Are Larger Than Issuance
US$1.4tn of estimated gross repurchases dwarfs US$700bn of estimated issuance.
3. Issuance Funds Growth
Markets are more willing to absorb supply when proceeds fund high-return investment themes such as:
AI infrastructure
Data centers
Semiconductors
Power / grid
AI software
Hyperscaler capacity
Supply is more digestible when it is viewed as financing future earnings growth rather than plugging balance-sheet holes.
12. Market Implications
Bullish for Index Level
The supply-demand backdrop supports the S&P 500 toward 8,000 view.
From Friday’s close of 7,757, a move to 8,000 implies:
8,000−7,7577,757=3.13%7,7578,000−7,757=3.13%
So the target is close enough that positioning / buybacks / earnings momentum could plausibly drive it in the near term.
Supportive for New Issues
The market remains open to:
IPOs
Follow-ons
Converts
SPACs
AI funding transactions
But investor selectivity will matter, especially after recent Tech earnings reactions where “in line” was punished.
Constructive for Banks / Capital Markets
Record issuance and buyback authorizations support:
Investment banking revenues
ECM desks
Exchanges
Market makers
Financials tied to capital markets activity
AI Financing Cycle Still Early
If AI capex exceeds cash flow, capital markets activity around AI should remain elevated for years.
Beneficiaries include:
Hyperscalers with strong balance sheets
AI infrastructure firms
Semiconductor equipment / memory suppliers
Data-center operators
Power / grid companies
Banks and credit markets facilitating funding
13. Key Risks to the View
The bullish supply-demand argument could be challenged if:
Buybacks slow materially.
Bond yields rise enough to pressure equity valuations.
AI ROI concerns return.
AI capex is seen as value destructive rather than growth enhancing.
Issuance broadens beyond investor appetite.
Lockup expiries coincide with risk-off markets.
Debt market capacity becomes constrained.
Hyperscaler funding needs crowd out other borrowers.
Earnings revisions weaken.
The most important risk is not issuance itself; it is whether investors continue to believe the issuance funds profitable growth.
Disclaimer: The material provided is for information purposes only and should not be considered as investment advice. The views, information, or opinions expressed in the text belong solely to the author, and not to the author’s employer, organization, committee or other group or individual or company.
Past performance is not indicative of future results.
High Risk Warning: CFDs are complex instruments and come with a high risk of losing money rapidly due to leverage. 69% and 73% of retail investor accounts lose money when trading CFDs with Tickmill UK Ltd and Tickmill Europe Ltd respectively. You should consider whether you understand how CFDs work and whether you can afford to take the high risk of losing your money.
Futures and Options: Trading futures and options on margin carries a high degree of risk and may result in losses exceeding your initial investment. These products are not suitable for all investors. Ensure you fully understand the risks and take appropriate care to manage your risk.
Patrick has been involved in the financial markets for well over a decade as a self-educated professional trader and money manager. Flitting between the roles of market commentator, analyst and mentor, Patrick has improved the technical skills and psychological stance of literally hundreds of traders – coaching them to become savvy market operators!